I. Introduction:
- For this post, we will performing profiling to determine which part of the program takes the most execution time and improve those specific parts
- The two approaches we will be using in this post is sampling and instrumentation
II. Getting started:
1. Sampling:
- Indicates the process of interrupting the running process constantly. As we interrupt the program, the stack will be analyzed to what it was doing at the time
2. Instrumentation:
- Involve the process of adding extra code to the program so that the function calls can be recorded
III. Tools:
1. Gprof:
- Utilizes both instrumentation and sampling approaches. Instrumentation is used to retrieve the call graph, which functions are called and how many times they were called while sampling is used to measure time spent in each function
- Required an additional version of the program to include the instrumentation code, this can be done be passing a special flag to the C/C++ compiler
2. Perf:
- Utilizes sampling method only which means we don’t need to create a separate version of the program to build the code
- However, there will be parts the sampling can’t catch because the interruption times are inefficient
IV. Profiling:
1. Gprof:
- First, we will need to clean the current version of the program with make clean and reconfigure the program for instrumentation process
- Because instrumentation means adding extra code to the generated, we can achieve that by invoke the following command

- In order to begin the profiling process using Gprof, we need to run the program normally first, then the output file of the profiling will be created
- Now we will use gprof to view the text output of this result file using the following command

- The result will be listing all the function time spent in each function and which one takes the longest time
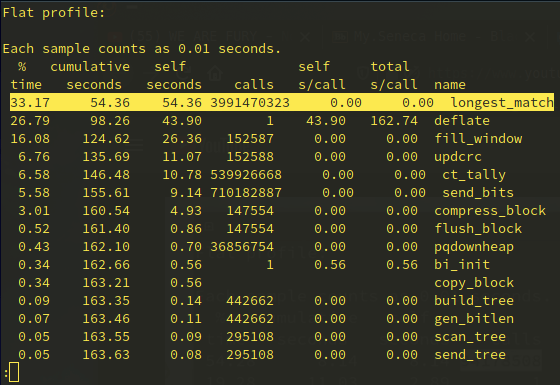
- The result is rather interesting because the function that takes the most amount of time is longest_match (33.17%) but the time spent in this function takes the least amount of time. Moreover, this function is not the function called the most, that title belongs to send_bits
- To retrieve the call graph, we need to pipe the result into other commands with

- And we receive the following call graph
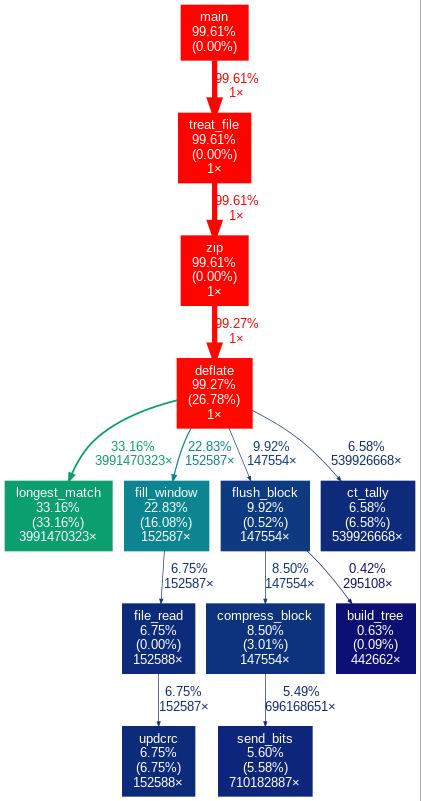
- According to the above graph, the program spent most of its time in deflate source code and it calls longest_match function the most
- Moreover, the difference between time spent in longest_match is significantly longer than other functions including fill_window
2. Perf:
- As mentioned above, this approach utilizes pure sampling which mean we don’t need to include -pg flags when build the program to generate extra code
- To begin with this approach, we will need to clean the existing version of the program that was built to include instrumentation process
- Since there is no extra code used for this approach, we will need to use perf to monitor the profiling process with the follwing command

- In order to view the result, we need to invoke the following command

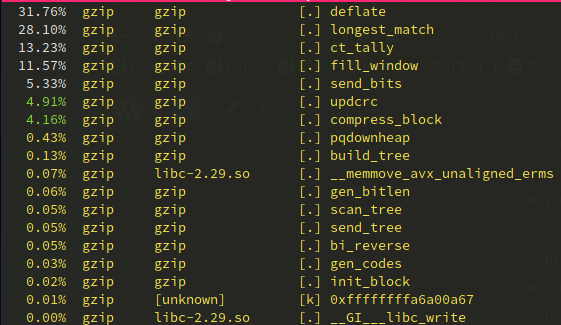
- Similar to the result page generated by gprof, we have a listing of all called function and time spent in each function
- Not only that, we can go inside each function to view the source code and see which specific lines of code are being called the most
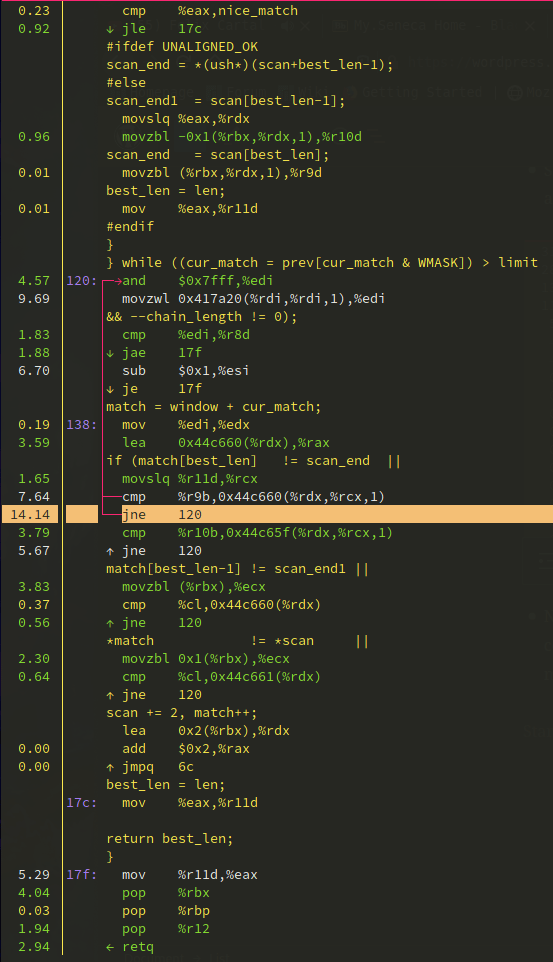
- According to this report, the line that is invoked the most is a loop which jump back to line 120 if the comparison in the previous line is not equal to scan_end
- Judging by the assembly code of the comparison, it’s utilized by comparing bytes to bytes, I believe this is the reason that the program is slowed down
V. Result:
- According to both the result from gprof and perf, I believe that if we can optimize the loop used in longest_match, we can significantly reduce the time spent for gzip
- Moreover, the report from perf showed that the line of code being used the most is comparison statement using bytes, so if we can optimize this process using another function that compares more than 1 bytes then the program should run faster
- Additionally, the comparison statement written in assembly also used several registers to retrieve a value, if we can change the data structure without compromising the code then the code can be faster as well

One thought on “Project: GZIP Profiling”